Categorical confusion#
- bullkpy.pl.categorical_confusion(adata, *, key1, key2, normalize='row', cmap='Blues', figsize=None, title=None, dropna=True, min_count=1, show=True, save=None)[source]#
Confusion-style heatmap for two categorical obs columns + association metrics.
Uses bk.tl.categorical_confusion() for computation (counts + normalized matrix + metrics).
Confusion-style heatmap for comparing two categorical observation columns, augmented with global association metrics.
This function is useful to visually assess agreement, mixing, or confusion between annotations such as:
batch vs cluster
predicted label vs ground truth
two alternative clusterings
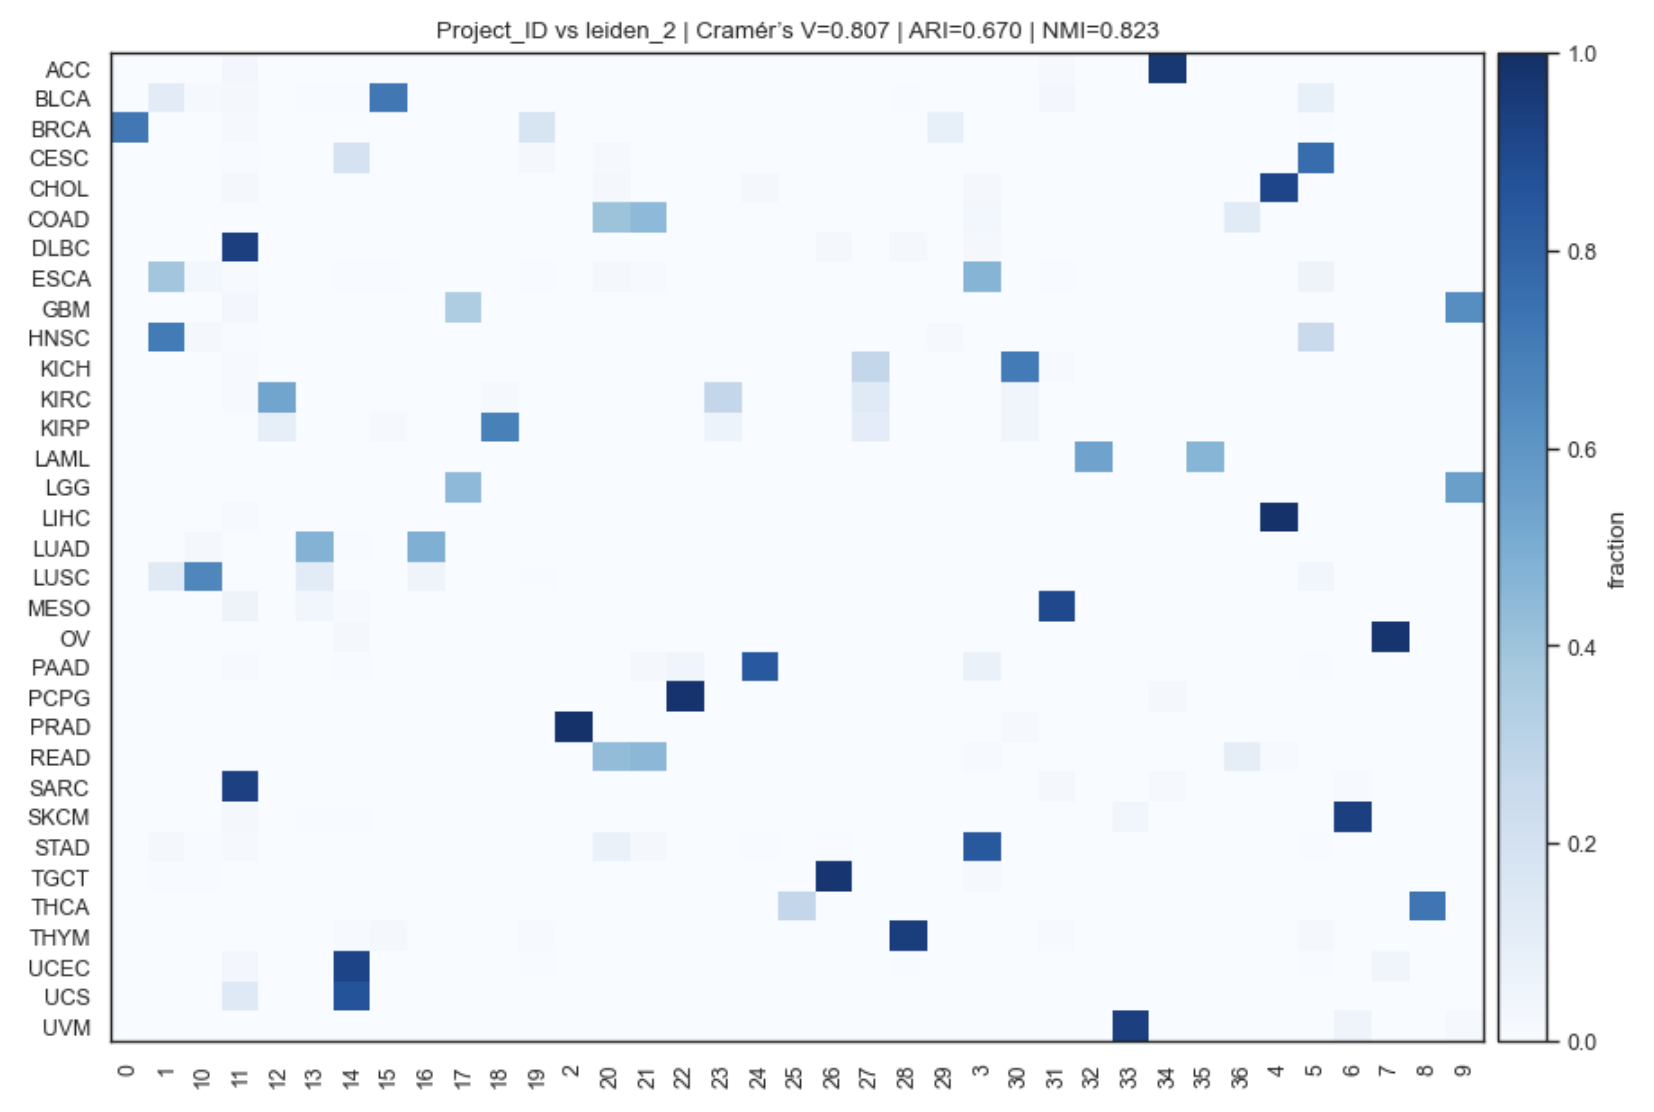
Example Categorical confusion plot
What it does#
Builds a contingency table between two categorical obs columns
Displays it as a heatmap (confusion-matrix style)
Supports multiple normalization modes
Computes and reports global association metrics: • Cramér’s V (always) • ARI (if sklearn available) • NMI (if sklearn available)
Adds metrics directly to the plot title
Parameters#
adata
AnnData object containing categorical annotations in .obs.
key1
First categorical obs column (rows of the heatmap).
key2
Second categorical obs column (columns of the heatmap).
normalize
Normalization mode for the contingency table:
“none” – raw counts
“row” (default) – rows sum to 1
“col” – columns sum to 1
“all” – global normalization (sum = 1)
cmap
Matplotlib colormap for the heatmap.
figsize
Figure size in inches.
If None, the size is inferred from the table dimensions.
title
Optional custom title.
If not provided, a title is generated automatically and includes metrics.
save
Path to save the figure.
show
Whether to display the plot.
Returns#
(fig, ax)
fig: matplotlib Figure
ax: matplotlib Axes.
Normalization modes#
Mode |
Description |
|---|---|
none |
Raw counts |
row |
Each row sums to 1 (conditional distribution of key2 given key1) |
col |
Each column sums to 1 |
all |
Entire table sums to 1 |
Reported metrics#
Cramér’s V
Measures strength of association between two categorical variables
(0 = independent, 1 = perfect association)
ARI (Adjusted Rand Index)
Measures clustering agreement (if sklearn available)
NMI (Normalized Mutual Information)
Measures shared information between labelings (if sklearn available)
Examples#
Batch vs cluster confusion (row-normalized)
bk.pl.categorical_confusion(
    adata,
    key1="batch",
    key2="leiden",
)
Ground truth vs predicted labels (column-normalized)
bk.pl.categorical_confusion(
    adata,
    key1="true_label",
    key2="predicted_label",
    normalize="col",
)
Raw counts with custom colormap
bk.pl.categorical_confusion(
    adata,
    key1="project",
    key2="cluster",
    normalize="none",
    cmap="viridis",
)
Notes#
Missing values are dropped before computing the contingency table.
Metrics are computed on the un-normalized table.
This is a global diagnostic plot; it does not perform per-cell significance tests.
See also#
•	tl.categorical_association
•	pl.ari_resolution_heatmap
•	pl.heatmap_association
•	pl.dotplot_association