Volcano plot#
- bullkpy.pl.volcano(res, *, gene_col='gene', fc_col='log2FC', p_col='pval', q_col='qval', use_qval=True, p_cutoff=0.05, fc_cutoff=0.0, title=None, figsize=(6.5, 5.5), alpha=0.85, point_size=18.0, color_ns='#BDBDBD', color_up='#D62728', color_down='#1F77B4', label_genes=(), top_n_labels=10, bottom_n_labels=10, label_fontsize=None, label_offset=(0.02, 0.02), show_thresholds=True, save=None, show=True)[source]#
Volcano plot for DE results.
- Coloring:
non-significant: grey
significant & log2FC > 0: red
significant & log2FC < 0: blue
- Labeling:
label_genes: explicit list
top_n_labels: top upregulated significant genes
bottom_n_labels: top downregulated significant genes (most negative log2FC)
Volcano plot for differential expression results.
This function visualizes log2 fold changes against statistical significance, highlighting up- and down-regulated genes and optionally labeling selected features.
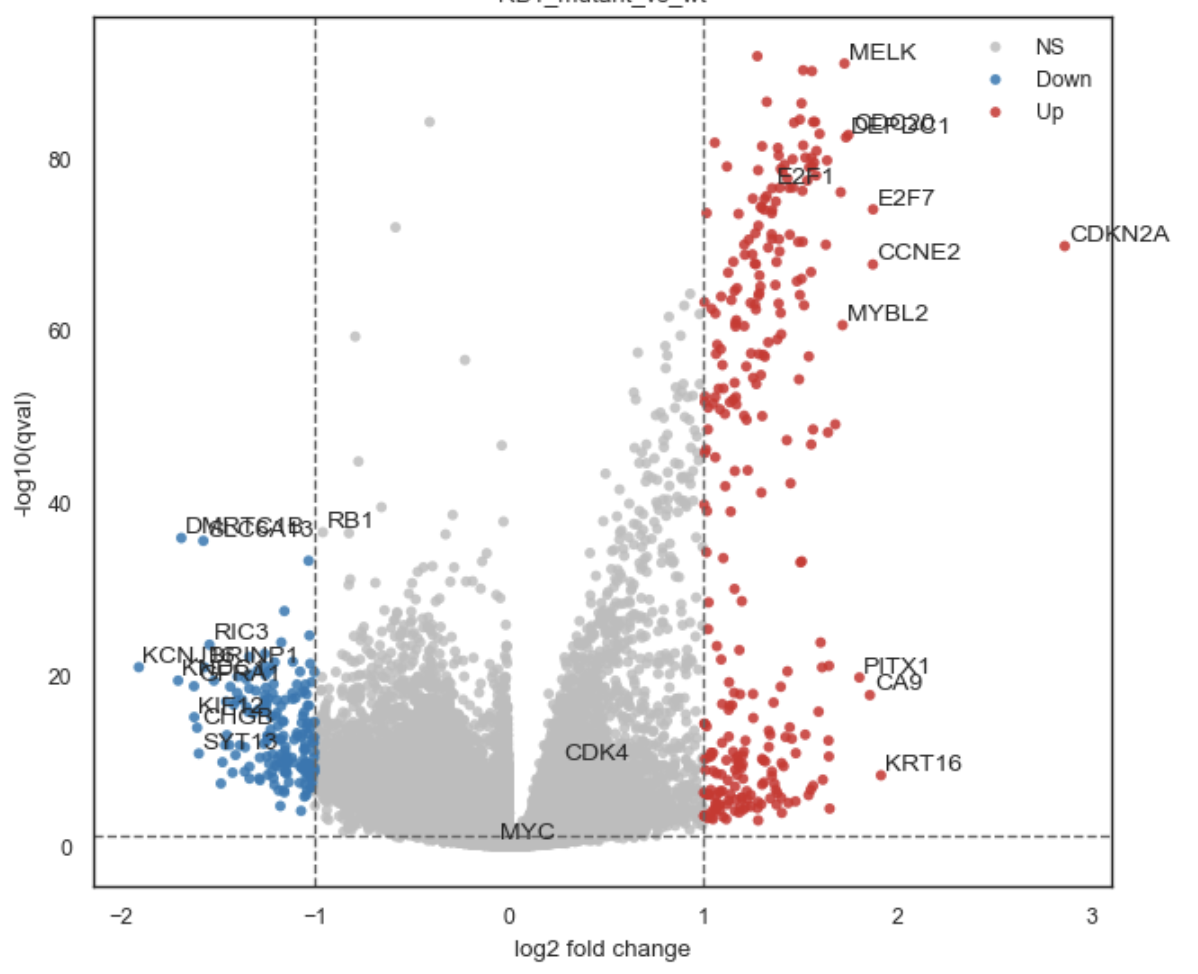
Example volcano plot.
What it does#
•	Plots log2 fold change vs −log10(p-value or q-value)
•	Colors genes by significance and direction:
•	Grey: non-significant
•	Red: significantly upregulated
•	Blue: significantly downregulated
•	Supports p-values or q-values
•	Adds optional threshold lines
•	Labels top significant genes or user-specified genes
•	Returns (fig, ax) for further customization
Expected input#
res must be a pandas.DataFrame containing at least: • gene_col — gene names (default: “gene”) • fc_col — log2 fold change (default: “log2FC”) • p_col — p-values (default: “pval”) • q_col — q-values (default: “qval”)
Parameters#
Core columns#
gene_col
Column containing gene names.
fc_col
Column containing log2 fold changes.
p_col
Column containing raw p-values.
q_col
Column containing multiple-testing corrected p-values.
use_qval
If True, significance is determined using q_col.
If False, p_col is used instead.
Thresholds#
p_cutoff
Significance threshold on p- or q-values.
fc_cutoff
Optional absolute log2FC threshold.
Set > 0 to require |log2FC| ≥ fc_cutoff.
Plot appearance#
figsize
Figure size in inches (width, height).
alpha
Point transparency.
point_size
Marker size.
color_ns, color_up, color_down
Colors for non-significant, upregulated, and downregulated genes.
show_thresholds
Draw horizontal and vertical threshold lines.
Labels#
label_genes
Explicit list of gene names to label.
top_n_labels
Number of top upregulated significant genes to label.
bottom_n_labels
Number of top downregulated significant genes to label.
label_fontsize
Font size for labels (default: auto).
label_offset
Small (x, y) offset for label placement (data units).
Output#
title
Optional plot title.
save
File path to save the figure.
show
Whether to display the plot with plt.show().
Returns#
•	fig — matplotlib.figure.Figure
•	ax — matplotlib.axes.Axes
Examples#
Basic volcano plot#
fig, ax = bk.pl.volcano(res)
Using q-values and fold-change cutoff#
bk.pl.volcano(
    res,
    use_qval=True,
    p_cutoff=0.05,
    fc_cutoff=1.0,
    title="Treatment vs Control",
)
Label selected genes#
bk.pl.volcano(
    res,
    label_genes=["TP53", "MYC", "CDKN1A"],
    show=False,
    save="volcano.png",
)
Label top hits automatically#
bk.pl.volcano(
    res,
    top_n_labels=15,
    bottom_n_labels=15,
)
Notes#
•	Infinite and missing values are removed automatically.
•	P-values are clipped to avoid -log10(0) artifacts.
•	For categorical contrasts, consider using pl.volcano_categorical.
See also#
•	pl.volcano_categorical
•	tl.differential_expression
•	pl.rankplot