UMAP plots#
- bullkpy.pl.umap(adata, *, basis='X_umap', color=None, layer='log1p_cpm', point_size=25.0, alpha=0.85, figsize=(6.5, 5.5), title=None, palette='Set1', cmap='viridis', highlight=None, grey_color='#D3D3D3', save=None, show=True)[source]#
Scanpy-like UMAP plotting.
- color can be:
None
obs column (categorical or numeric)
gene name (continuous, from layer)
list of any of the above -> multiple panels in one row
highlight (categoricals): show only selected classes in color, all others grey.
Provides UMAP scatter plots from an embedding stored in adata.obsm
(default key: "X_umap"). Coloring supports:
no color (plain scatter),
gene expression (continuous colormap),
adata.obscolumns (categorical with legend, or numeric with colorbar),multi-panel plots via a list of color keys,
optional “highlight” mode to emphasize selected categories.
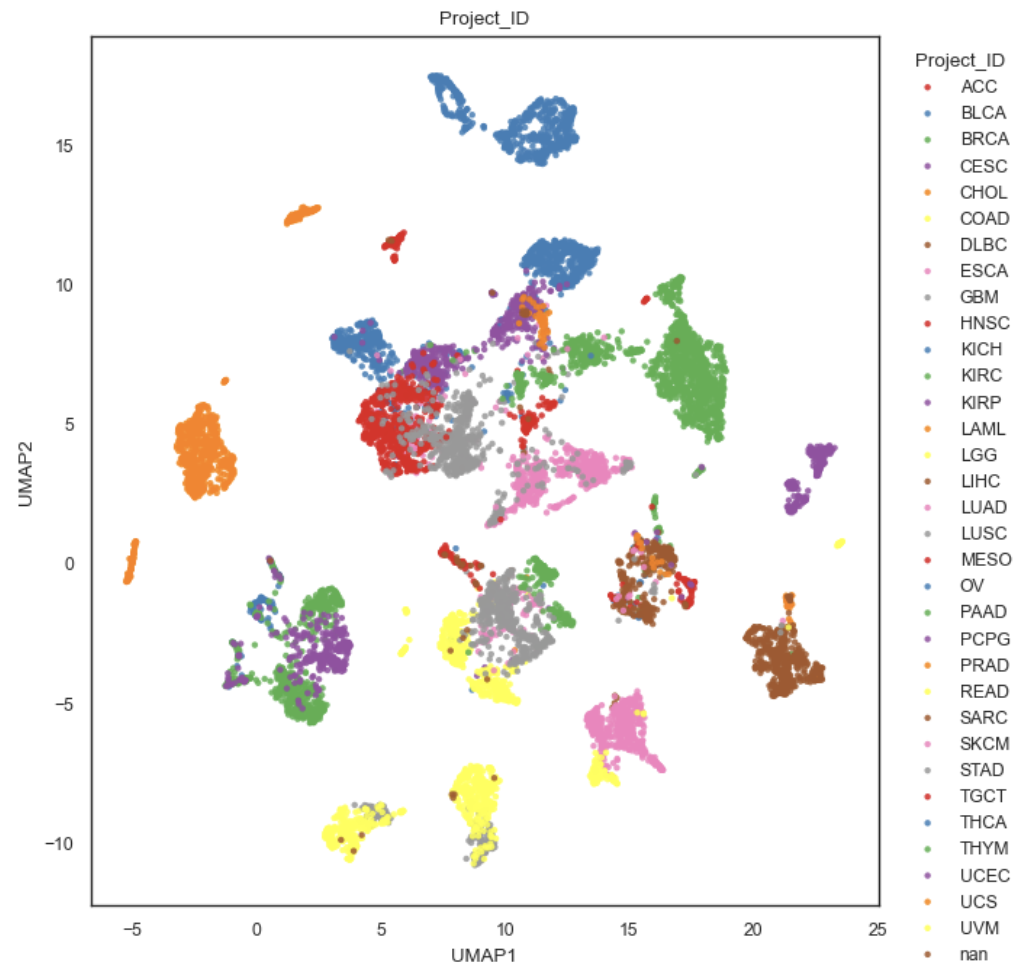
Example UMAP plot
What it does.#
Reads a 2D embedding from adata.obsm[basis] and uses:
x = embedding[:, 0] (UMAP1)
y = embedding[:, 1] (UMAP2).
Plots one or multiple panels depending on color:
If color is a string → one panel.
If color is a list → one panel per entry in a single row.
If color=None → a single uncolored panel.
Delegates all per-panel logic (coloring, legends, colorbars, highlight behavior) to the internal function: _plot_embedding_one().
Parameters#
•
basis (str, default “X_umap”): Key in adata.obsm containing the embedding.
Must exist, otherwise raises KeyError.
color (str | list[str] | None): How to color points, per panel.
If None: no color.
gene name in adata.var_names: expression coloring (continuous).
obs key in adata.obs.columns: categorical or numeric coloring.
list of any mix of the above: multi-panel row.
**layer (str | None, default “log1p_cpm”): Expression source used when color is a gene.
Passed through to _get_gene_vector(adata, gene, layer=layer).
point_size (float): Marker size (s= in matplotlib).
**alpha **(float): Marker transparency.
figsize ((w, h)): Base size for a single panel.
If multiple panels, width is multiplied by n_panels, height stays the same.
title (str | None): Title control:
If exactly one panel and title provided → used as panel title.
Otherwise each panel gets: – “UMAP” if uncolored, – str(color_key) if colored.
palette (str, default “Set1”): Palette name for categorical obs coloring.
cmap (str, default “viridis”): Colormap for continuous coloring (genes or numeric obs).
highlight (str | list[str] | None): Optional emphasis mode (see “Highlight mode”).
grey_color (str, default “#D3D3D3”): Background color used in highlight mode.
save (str | Path | None): If provided, saves via _savefig(fig, save).
show (bool): If True, calls plt.show().
Returns#
fig: matplotlib.figure.Figure.
axes: list of matplotlib.axes.Axes (one per panel).
Raises#
KeyError if basis not found in adata.obsm.
_plot_embedding_one#
Internal helper that draws one embedding scatter plot on a provided Axes.
Behavior summary (decision tree)#
Given color:
color is None: plain scatter (no legend, no colorbar).
color matches a gene (color in adata.var_names): continuous coloring by expression:
vals = _get_gene_vector(adata, color, layer=layer)
scatter with c=vals, cmap=cmap
adds a colorbar labeled with the gene name.
color matches adata.obs key (color in adata.obs.columns). Let s = adata.obs[color]:
if categorical-like → categorical legend
if numeric-like → continuous colorbar
else → fallback to categorical strings.
Otherwise (not in obs, not a gene): warns and falls back to plain scatter.
Parameters (panel-level).#
ax: target axis to draw on.
x, y: embedding coordinates (1D arrays length adata.n_obs).
adata: AnnData for metadata and expression lookup.
color: key for coloring, or None.
layer: expression layer used for gene coloring.
point_size, alpha: scatter styling.
palette: categorical palette name.
cmap: colormap for continuous values.
highlight: optional highlight selection (see below).
grey_color: background color when highlight is active.
title: optional panel title.
xlabel, ylabel: axis labels (usually “UMAP1”, “UMAP2”).
Categorical coloring#
A series s = adata.obs[color] is treated as categorical when _is_categorical_series(s) is true. In that case:
categories are converted to strings,
a palette mapping is created via _categorical_palette(names, palette=palette),
points are plotted category-by-category to enable a legend.
Legend placement:
bbox_to_anchor=(1.02, 1), loc=”upper left”, frameon=False
Continuous coloring (numeric obs or gene expression)#
If coloring is continuous (gene expression or numeric obs):
points are plotted with c=vals and cmap=cmap
a colorbar is added:
pad=0.01, fraction=0.05
for genes, the colorbar label is set to the gene name.
Highlight mode#
highlight is intended primarily for categorical obs annotations.
For categorical color:
If highlight is provided:
plot all points in grey_color.
plot only the highlighted categories in color (using the palette).
add a legend titled “{color} (highlight)”.
This is useful to emphasize a subset (e.g. specific subtypes) while keeping context.
For numeric color (simple default):
If highlight is provided and color is numeric:
plot all points in grey
re-plot only points where vals are finite and vals != 0
color those by value and add a colorbar
This behavior is a pragmatic “show signal on top of grey background” mode.
Multi-panel plotting#
When bk.pl.umap(color=[…]):
creates n subplots in a single row,
each element of the list is passed to _plot_embedding_one,
titles are set per panel unless a single-panel custom title is provided.
Example:
bk.pl.umap(
    adata,
    color=["Subtype", "DLL3", "total_counts"],
    layer="log1p_cpm",
    highlight=["Basal", "NE-high"],   # applies to categorical panels; numeric panels use nonzero mask behavior
)
Notes & tips#
To plot gene expression, color must exactly match entries in adata.var_names.
If you want consistent continuous scaling across panels, you’d need to extend the API to pass vmin/vmax (current implementation relies on matplotlib defaults).
For very large cohorts, consider reducing point_size and/or alpha for readability.