Boxplot with statistics#
- bullkpy.pl.boxplot_with_stats(adata, *, y, groupby, figsize=(7, 3.5), kind='violin', show_points=True, point_size=2.0, point_alpha=0.3, title=None, save=None, show=True)[source]#
Box/violin plot of a numeric obs column across categorical groups, with a simple global p-value annotation.
If 2 groups: Mann–Whitney U
If >2 groups: Kruskal–Wallis
Returns (fig, ax).
Scanpy-like boxplot or violin plot for a numeric observation, annotated with a global statistical test across groups.
This is a lightweight exploratory plotting utility designed for bulk RNA-seq and metadata inspection.
The test is global (no pairwise post-hoc comparisons).
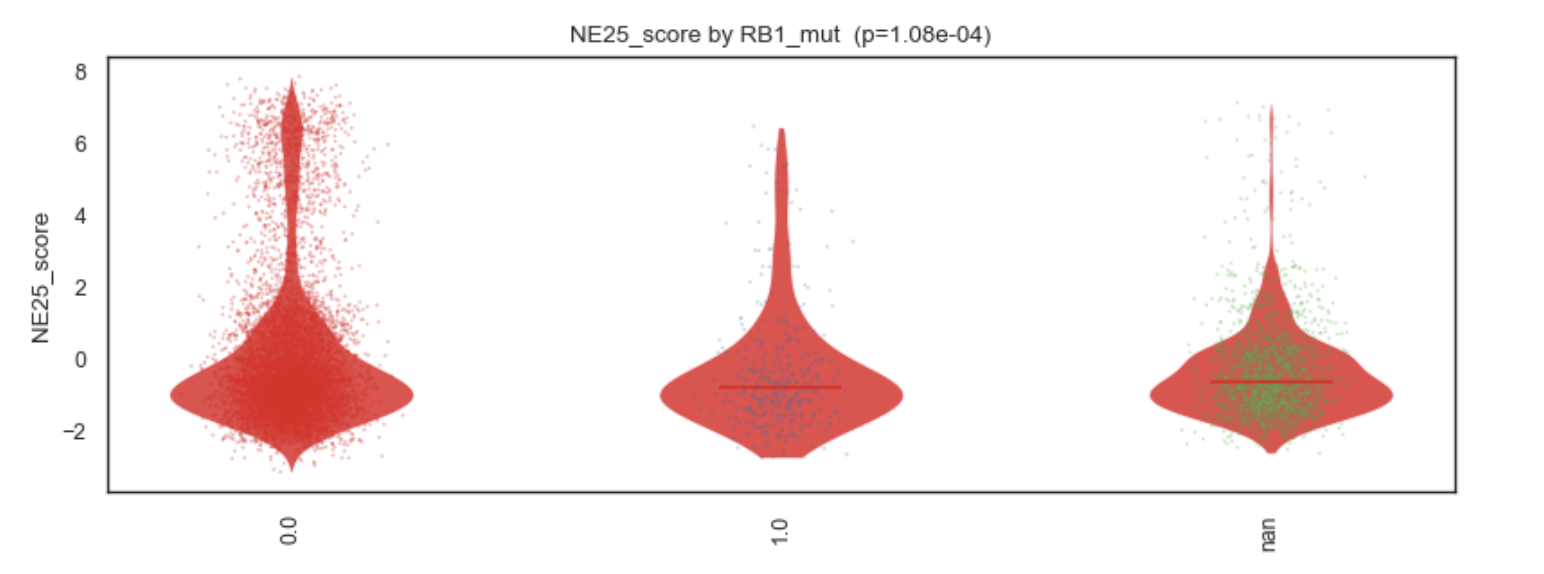
Example Boxplot with statistics
What it does#
Plots a numeric obs column (y) across categories (groupby)
Supports boxplot or violin styles
Optionally overlays individual sample points
Computes and displays a global p-value: – 2 groups → Mann–Whitney U test. – >2 groups → Kruskal–Wallis test.
Adds the p-value directly to the plot title.
This mirrors common Scanpy QC/metadata plots but avoids heavy dependencies.
Parameters#
adata
AnnData object containing the observations.
y
Numeric column in adata.obs to plot (e.g. “pct_counts_mt”, “age”).
groupby
Categorical column in adata.obs defining groups.
figsize
Figure size in inches.
kind
Plot type:
“violin” (default)
“box”
show_points
Overlay individual sample points with jitter.
point_size
Size of overlaid points.
point_alpha
Transparency of overlaid points.
title
Optional custom title.
If not provided, a title is generated automatically and includes the p-value.
save
Path to save the figure.
show
Whether to display the plot.
Returns#
(fig, ax)
fig: matplotlib Figure
ax: matplotlib Axes.
Statistical testing#
Number of groups |
Test used |
|---|---|
2 |
Mann–Whitney U (two-sided) |
>2 |
Kruskal–Wallis |
The test is global (no pairwise post-hoc comparisons).
Examples#
Violin plot of a QC metric
bk.pl.boxplot_with_stats(
    adata,
    y="pct_counts_mt",
    groupby="condition",
)
Boxplot with overlaid points
bk.pl.boxplot_with_stats(
    adata,
    y="libsize",
    groupby="batch",
    kind="box",
    show_points=True,
)
Custom title and save to file
bk.pl.boxplot_with_stats(
    adata,
    y="age",
    groupby="sex",
    title="Age distribution by sex",
    save="age_by_sex.png",
)
Suppress display (batch plotting)
bk.pl.boxplot_with_stats(
    adata,
    y="n_genes_detected",
    groupby="project",
    show=False,
)
Notes#
Missing values are automatically dropped.
Groups with no valid observations are ignored.
Jitter for points is deterministic (fixed random seed).
This function is intended for exploration, not publication-grade inference.
See also#
•	pl.violin
•	tl.obs_categorical_association
•	pl.rankplot_association
•	pl.dotplot_association