Gene Association Volcano#
- bullkpy.pl.gene_association_volcano(adata, *, groupby, group, reference=None, layer='log1p_cpm', genes=None, method='mwu', effect='delta_mean', alpha=0.05, top_labels=12, figsize=(6.5, 5.5), title=None, save=None, show=True)[source]#
- Effect-size aware volcano for categorical association:
x = effect size (delta_mean or delta_median between group vs reference/rest) y = -log10(q)
This is NOT a full DE method — it’s a fast association scan.
Effect-size aware volcano plot for a fast categorical gene–group association scan.
This function compares expression of each gene between:
a target group (
group) defined byadata.obs[groupby], anda reference group (
reference) or all other samples (reference=None→"rest")
and visualizes:
x-axis: effect size (
delta_meanordelta_median)y-axis: significance as
-log10(qval)(BH/FDR-corrected).
⚠️ This is not a full differential expression workflow (no model, no covariates, no library-size offsets). It’s designed as a quick screening/association plot.
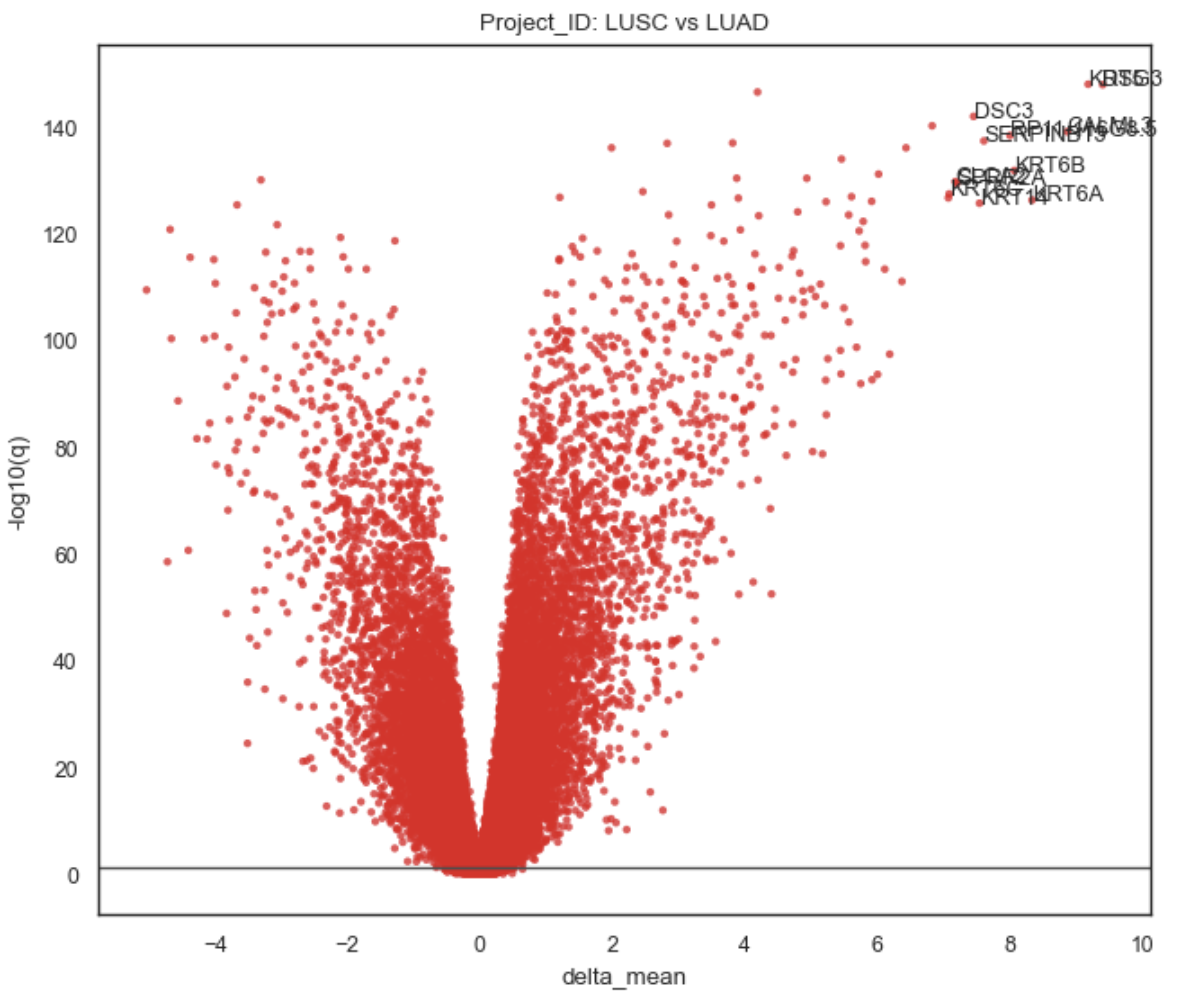
Example Gene Association Volcano plot
What it does#
Group masks
m1: samples where
adata.obs[groupby] == groupm2: samples where:
reference is None → all samples not in group (“rest”)
otherwise
adata.obs[groupby] == reference
Requires ≥ 2 samples in both m1 and m2.
Input matrix
Expression values are taken from:
adata.layers[layer]if layer is not None and existsotherwise
adata.X.
If genes is provided, it restricts to those genes (must exist in adata.var_names).
Per-gene test (current implementation)
method=”mwu”: two-sided Mann–Whitney U test (scipy.stats.mannwhitneyu) per gene.
This yields a raw pval per gene.
Effect size for plotting
Pick one:
effect="delta_mean":
[
\Delta = \mathrm{mean}(x_1) - \mathrm{mean}(x_2)
]effect="delta_median":
[
\Delta = \mathrm{median}(x_1) - \mathrm{median}(x_2)
]
Multiple testing
Applies Benjamini–Hochberg FDR to pval → qval.
Then computes:
[
\text{neglog10q} = -\log_{10}(\max(qval, 1e{-300}))
]
Plot behavior#
Scatter of all genes: (effect, -log10(q))
Horizontal threshold line at q = alpha:
[
y = -\log_{10}(\alpha)
]Title defaults to: “{groupby}: {group} vs {ref_name}”
Labeling (top_labels)
The function:
takes the most significant genes (best q-values),
then prioritizes largest absolute effect among those,
and annotates up to top_labels genes.
Parameters#
Required#
adata
AnnData with adata.obs[groupby] and gene expression in adata.X or a layer.
groupby
Categorical obs column used to define groups.
group
The target category to test.
Common options#
reference
None (default): compare group vs all other samples (“rest”)
str: compare group vs that specific category only
layer
Expression source layer (default “log1p_cpm”). Use None to use adata.X.
genes
Subset of genes to test/plot (recommended for speed on large matrices).
effect
“delta_mean” (default) or “delta_median” for the x-axis.
alpha
FDR threshold used for the horizontal line.
top_labels
Number of gene labels to annotate.
save, show
Save to file and/or display the plot.
Returns#
(fig, ax, df)
fig, ax: Matplotlib objects
df: tidy results table with columns:
gene
effect
pval
qval
neglog10q.
Sorted by qval (best first).
Notes / tips#
Use a normalized/log layer for layer (e.g. “log1p_cpm”) so effect sizes are comparable across samples.
If you want a more “DE-like” effect, consider using
effect="delta_median"for robustness.For proper DE with covariates, batch correction, and count models, use your GLM/NB-DE functions instead of this scan.
Examples#
Group vs rest (default)
fig, ax, df = bk.pl.gene_association_volcano(
    adata,
    groupby="Subtype",
    group="Basal",
    layer="log1p_cpm",
)
Group vs specific reference
fig, ax, df = bk.pl.gene_association_volcano(
    adata,
    groupby="Subtype",
    group="Basal",
    reference="Luminal",
    layer="log1p_cpm",
    effect="delta_median",
    alpha=0.01,
)
Restrict to a gene panel
panel = ["ASCL1", "NEUROD1", "POU2F3", "YAP1", "DLL3"]
fig, ax, df = bk.pl.gene_association_volcano(
    adata,
    groupby="Subtype",
    group="Basal",
    genes=panel,
    top_labels=5,
)