Rankplot#
- bullkpy.pl.rankplot(adata=None, *, res=None, uns_key=None, contrast=None, n_genes=20, sort_by='qval', direction='both', fc_col=None, figsize=(7, 6), title=None, save=None, show=True)[source]#
Ranked horizontal barplot of top DE genes (up/down).
Upregulated bars: red
Downregulated bars: blue
sort_by supports: qval, pval, log2FC
For direction=”both”: top shows strongest upregulated; bottom shows strongest downregulated (last).
Ranked horizontal barplot of top differentially expressed genes.
This plot is useful to quickly inspect the strongest upregulated and/or downregulated genes
from a DE result table (typically produced by bk.tl.de()).
Upregulated bars: red
Downregulated bars: blue
Supports ranking by q-value, p-value, or log2FC.
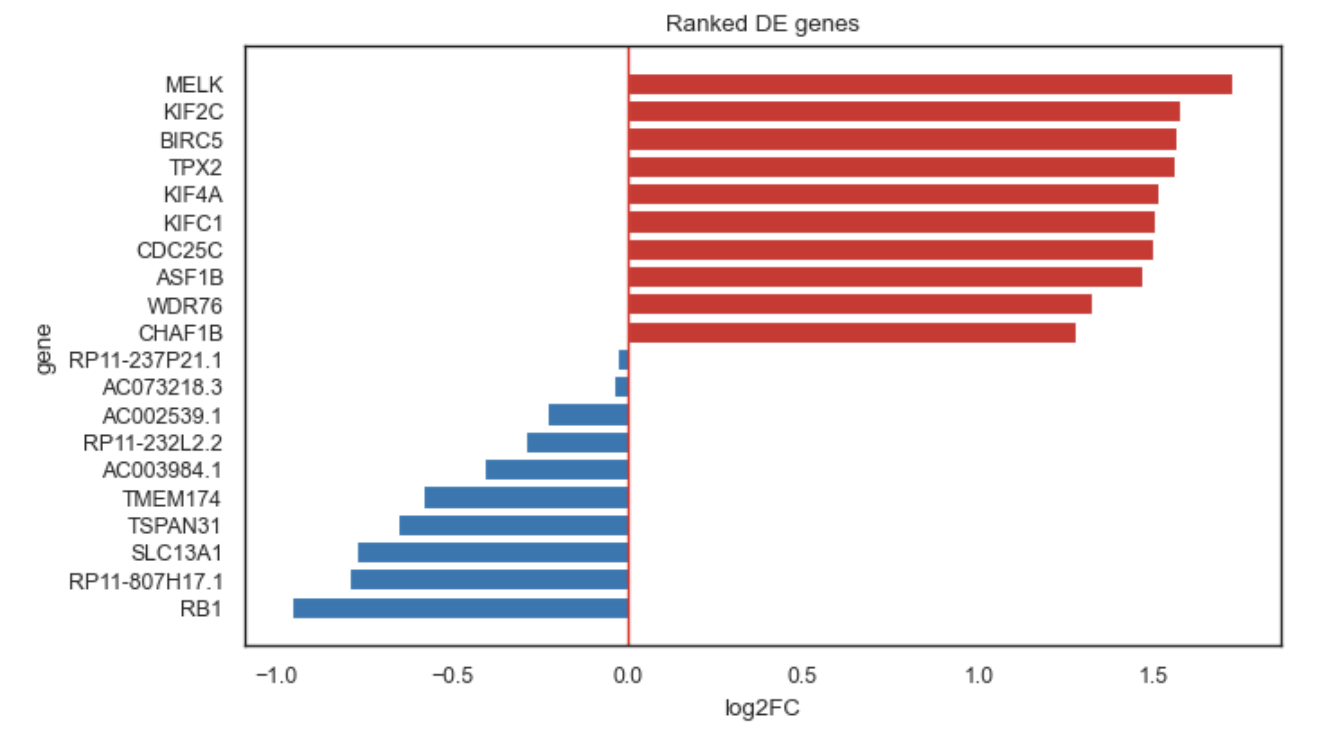
Example rankplot.
What it does#
Selects the top genes according to:
Significance (default: sort_by=”qval”), or
Effect size (sort_by=”log2FC”)
Filters by direction:
“up”: only positive fold-change genes
“down”: only negative fold-change genes
“both”: split between up and down
Orders bars Scanpy-like:
Top of the plot: strongest upregulated (largest positive log2FC)
Bottom of the plot: most downregulated (most negative log2FC) is last
Inputs#
You can provide DE results in two equivalent ways:
A) Directly via res#
A dataframe with at least:
• gene column (or first column used as gene name)
• log2FC (or logFC)
• qval / pval (depending on sort_by)
B) From adata.uns#
If you ran DE storing results in adata.uns, use:
adata + uns_key and/or contrast
Parameters#
Result source#
adata
AnnData object containing stored DE results in .uns (optional if res is provided).
res
DE results dataframe (optional if adata + uns_key are provided).
uns_key
Key inside adata.uns where DE tables are stored.
contrast
Which contrast to plot (if DE results store multiple contrasts).
Ranking & selection#
n_genes
Number of genes to display.
sort_by
How genes are selected:
• “qval” (default): most significant first
• “pval”: most significant first
• “log2FC”: strongest effects first
direction
Which direction to include:
• “up”: only positive log2FC
• “down”: only negative log2FC
• “both”: mix of up + down (split roughly half/half)
fc_col
Fold-change column. If None, automatically detects:
• “log2FC” if available, else “logFC”
Plot and output#
figsize
Matplotlib figure size.
title
Title override.
save
Save path for the figure.
show
If True, calls plt.show().
Returns#
•	fig — matplotlib.figure.Figure
•	ax — matplotlib.axes.Axes
Examples#
Plot top genes from a DE dataframe#
fig, ax = bk.pl.rankplot(
    res=res,
    n_genes=30,
    sort_by="qval",
    direction="both",
)
Upregulated only (largest positives first)#
bk.pl.rankplot(
    res=res,
    direction="up",
    n_genes=20,
)
Downregulated only (most negative is last)#
bk.pl.rankplot(
    res=res,
    direction="down",
    n_genes=20,
)
Rank purely by effect size#
bk.pl.rankplot(
    res=res,
    sort_by="log2FC",
    direction="both",
    n_genes=40,
)
Notes#
•	If sort_by="qval" or "pval", genes are selected by significance first, then ordered by fold-change for display.
•	If sort_by="log2FC", genes are selected directly by the magnitude and sign of fold-change.
•	This function is complementary to pl.volcano(), which shows all genes at once.
See also#
•	pl.volcano
•	tl.de
•	pl.rankplot_association