Gene Plot#
- bullkpy.pl.gene_plot(adata, *, gene, groupby, layer='log1p_cpm', groups=None, order=None, kind='both', show_points=True, point_size=3.0, point_alpha=0.7, test='auto', compare=None, add_pvalue=True, show_n=True, ylabel=None, title=None, figsize=None, save=None, show=True)[source]#
Plot one gene across groups (bulk): violin/box + optional p-value.
If compare=[‘A’,’B’] -> pairwise test + bracket annotation.
Else -> overall test across all groups (ANOVA or Kruskal).
- Returns:
fig, ax, stats_dict
Plot expression of a single gene across categories in adata.obs[groupby] (bulk-friendly),
with violin/box overlays, optional jittered points, and optional statistical testing
(either an overall test across all groups, or a pairwise comparison with a bracket).
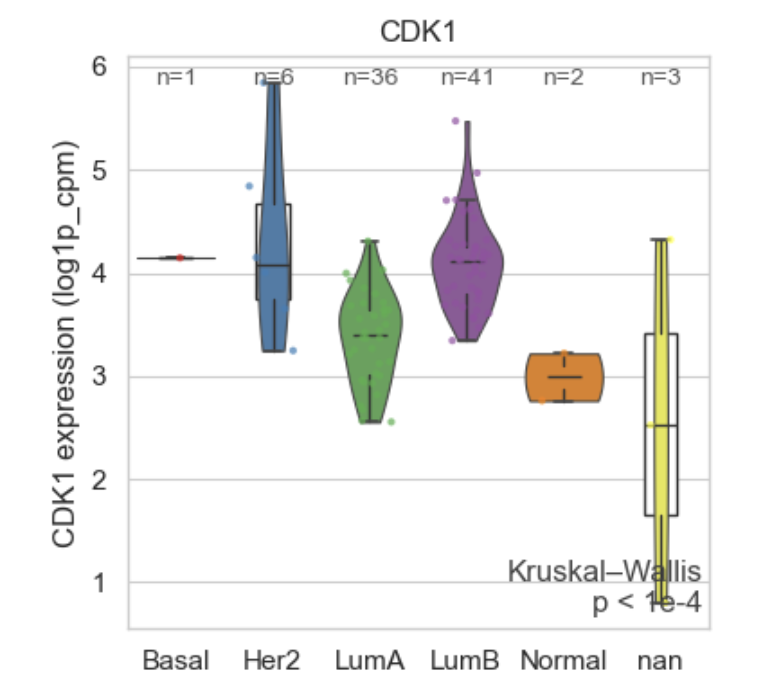
Example Gene plot
What it does#
1. Extracts gene expression
Uses _get_vector(adata, gene, layer) to get a per-sample expression vector.
2. Selects and orders groups
Reads categories from
adata.obs[groupby](converted to str).Optionally subsets samples with groups=[…].
Category order:
If order is None: uses `sorted(unique(groups))
Else: uses order filtered to those present in the data.
3. Builds a tidy DataFrame
df = DataFrame({“group”: categorical_group, “value”: expression}).dropna()
Raises if nothing remains after filtering.
4. Plots distribution
Requires seaborn.
kind=”violin”: violin plot (no inner marks; cut=0).
kind=”box”: box plot overlay (white fill, no fliers).
kind=”both”: violin + box overlay (default).
Optional scatter points via sns.stripplot (jittered).
5. Annotates sample counts (optional)
If show_n=True, writes n=… above each category.
6. Computes and displays p-values (optional)
Requires scipy.
If compare=[“A”,”B”]:
Performs a pairwise test between those two categories
Default (test=”auto”): Mann–Whitney U (labeled “wilcoxon-style” in docstring)
If test=”t-test”: Welch’s t-test
Draws a significance bracket + formatted p-value above the two groups.
If compare is None:
Performs an overall test across all plotted groups
Default (test=”auto”): Kruskal–Wallis
If test=”anova”: one-way ANOVA
Writes test name + p-value in the bottom-right of the axes.
7. Returns stats
Returns a small stats_dict with:
test: name of the test used (or a warning message)
pvalue: float p-value (or NaN)
compare: [A, B] if pairwise, else None
Parameters#
Required#
adata
AnnData with expression and group metadata.
gene
Gene symbol (must be retrievable by _get_vector).
groupby
Categorical adata.obs column used to define groups.
Expression source#
layer.
Which layer to use (default “log1p_cpm”). If None, _get_vector may fall back to adata.X.
Subsetting and ordering#
groups
Optional list of categories to include (filters samples to those groups only).
order
Explicit category order for the x-axis.
Plot style#
kind
“violin”, “box”, or “both” (default).
show_points
Overlay jittered points.
point_size, point_alpha
Styling for the points.
ylabel
If None, uses: “{gene} expression ({layer})” (layer omitted if None).
title
If None, uses gene.
figsize
If None, auto-sizes based on number of categories:
(max(5.0, 0.8 * n_groups + 2.2), 4.2).
Statistics#
add_pvalue
If True, compute and display p-values.
compare
If provided (e.g. [“LumA”,”LumB”]), run a pairwise test and draw a bracket.
test
Which test to use:
“auto”: – pairwise: Mann–Whitney U – overall: Kruskal–Wallis
“t-test”: Welch’s t-test (pairwise only)
“wilcoxon”: treated as Mann–Whitney U (pairwise)
“anova”: one-way ANOVA (overall)
kruskal”: Kruskal–Wallis (overall)
Output#
save
Path to save the figure.
show
If True, calls plt.show().
Returns#
fig, ax, stats_dict
fig: Matplotlib Figure
ax: Matplotlib Axes
stats_dict: dictionary with test metadata:
– {“test”: str|None, “pvalue”: float|None, “compare”: list[str]|None}
Notes / interpretation#
This function is intended for quick visualization and lightweight inference.
For many groups, the overall Kruskal–Wallis p-value tells you if any group differs, but not which pairs differ (use compare=… for targeted pairs).
Pairwise tests do not apply multiple-testing correction here (it’s a single requested pair).
Examples#
Default violin+box with overall Kruskal–Wallis
fig, ax, st = bk.pl.gene_plot(adata, gene="DLL3", groupby="Subtype")
Subset to specific groups and run pairwise test with bracket
fig, ax, st = bk.pl.gene_plot(
    adata,
    gene="SOX10",
    groupby="Subtype",
    groups=["LumA", "LumB", "Basal"],
    compare=["LumA", "Basal"],
    test="auto",
)
Force ANOVA across all plotted groups
fig, ax, st = bk.pl.gene_plot(
    adata,
    gene="EPCAM",
    groupby="Subtype",
    test="anova",
)