Heatmap Differential Expression#
- bullkpy.pl.heatmap_de(adata, *, contrast, de_key='de', results_key='results', layer='log1p_cpm', groupby=None, groups=None, top_n=50, mode='both', sort_by='qval', z_score='row', clip_z=3.0, cmap='vlag', center=0.0, col_colors=None, dendrogram_rows=True, dendrogram_cols=True, show_sample_labels=False, figsize=None, cbar_label='z-scored expression', save=None, show=True)[source]#
- Heatmap of top DE genes using results stored at:
adata.uns[de_key][contrast][results_key]
- Expected DE columns:
[‘gene’, ‘log2FC’, ‘t’, ‘pval’, ‘qval’, ‘mean_group’, ‘mean_ref’]
Heatmap values come from layer (default: log1p_cpm)
Gene selection uses DE table (default sort: qval)
Optionally subset/order samples by groupby and groups
Plot a clustered heatmap of the top differentially expressed (DE) genes for a given contrast, using DE results stored in adata.uns.
This helper is meant to be “Scanpy-ish” for bulk-friendly DE outputs: it selects genes from a DE results table (by q-value / p-value / effect size), extracts expression from a chosen layer, optionally z-scores per gene, and draws a seaborn clustermap with optional column annotations.
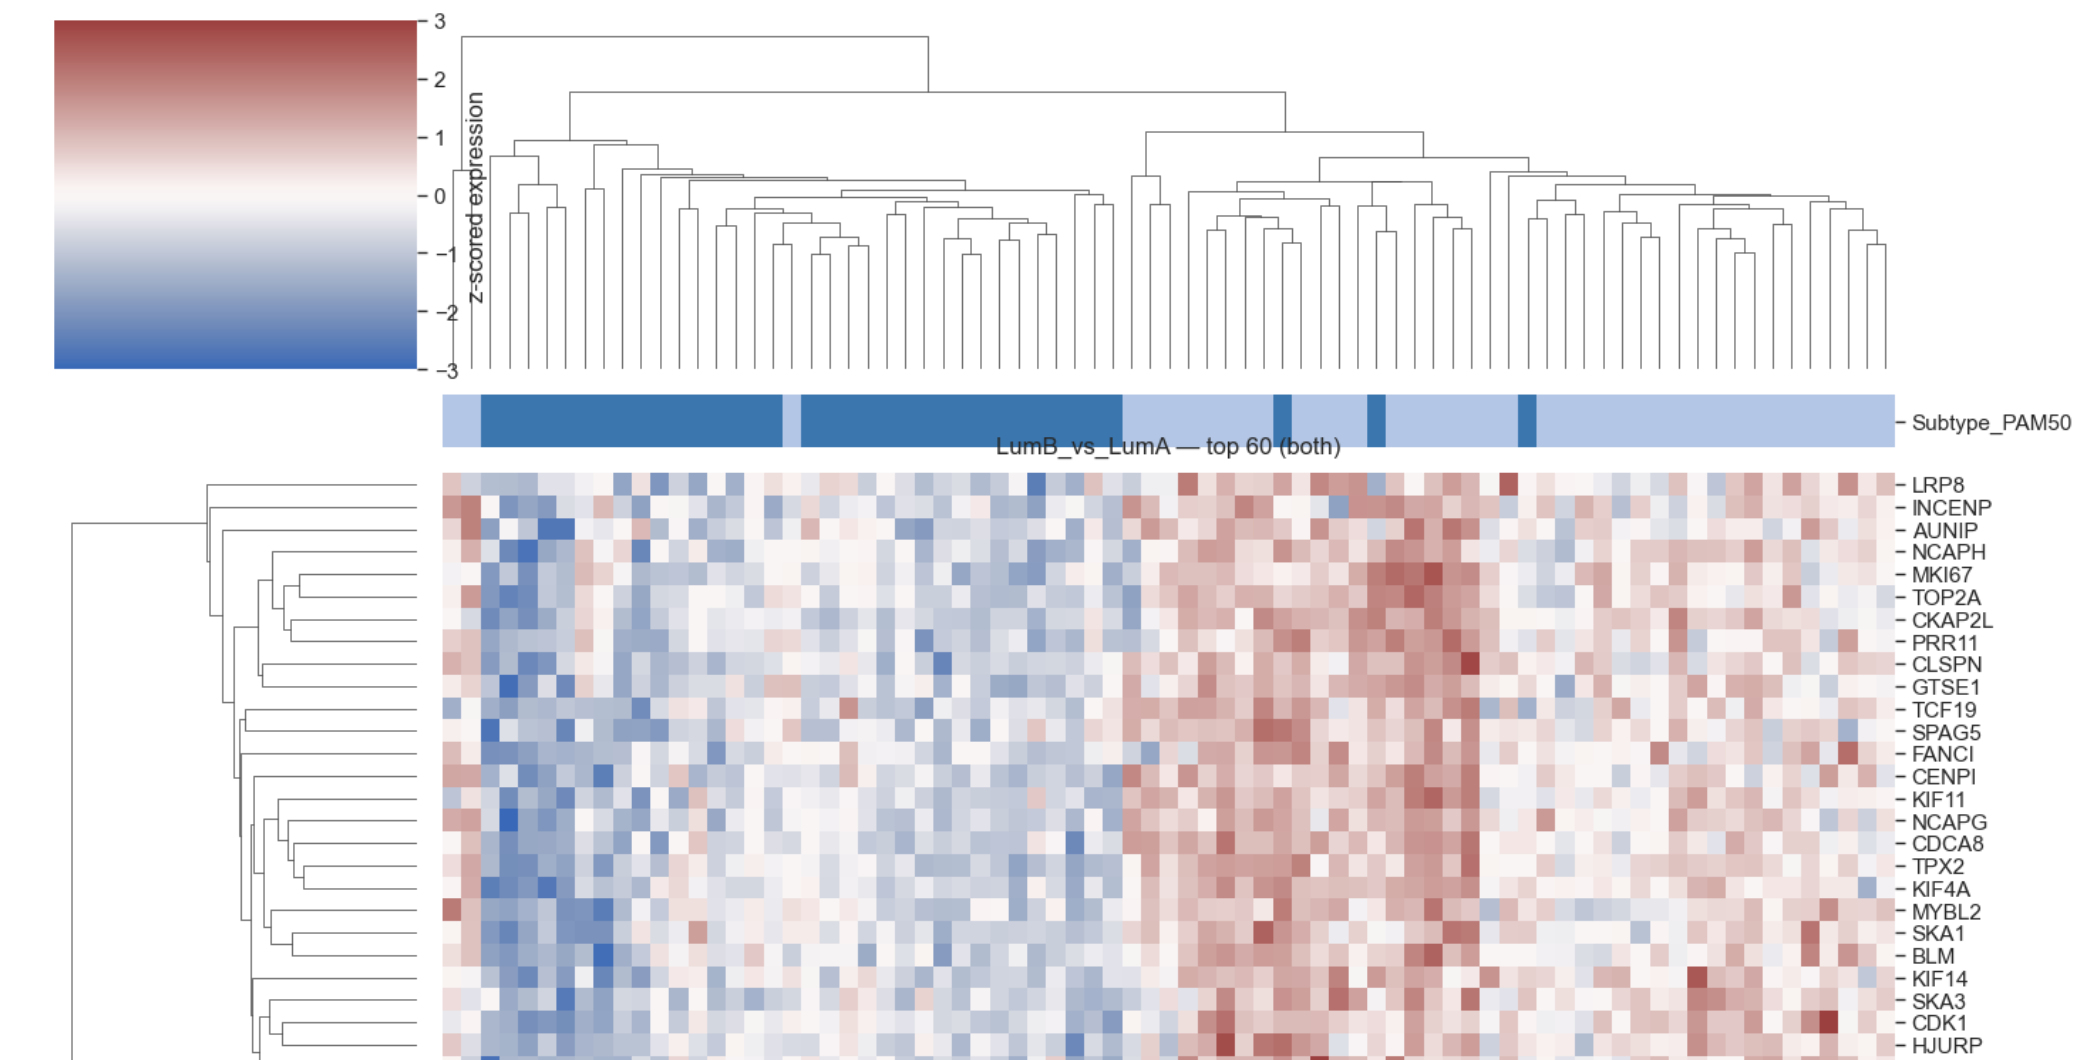
Example heatmap differential expression
Expected input structure#
DE results are expected at:
adata.uns[de_key][contrast][results_key]
Expected DE table columns#
Minimum required:
gene (string-like)
log2FC (float)
Common/expected (recommended):
t (test statistic; e.g., t-stat or z-like)
pval
qval
mean_group
mean_ref
If sort_by is not present, the function falls back to:
“qval” if available, else “pval” if available, else “log2FC”.
Parameters#
Required#
adata: anndata.AnnData. Contains expression (adata.X and/or layers) and sample metadata (adata.obs).
contrast: str
Key used inside adata.uns[de_key] (e.g., “Subtype:Basal_vs_Luminal”).
Where to read DE results from#
de_key: str (default “de”).
Top-level key under adata.uns holding DE outputs.
results_key: str (default “results”).
Key under adata.uns[de_key][contrast] containing the DE table.
Expression source#
laye: str | None (default “log1p_cpm”).
Expression values used for the heatmap are read via _get_matrix(adata, layer).
Typically:
if layer exists, use adata.layers[layer]
else use adata.X.
Sample subsetting and ordering#
groupby: str | None. If provided, samples can be subset and ordered by adata.obs[groupby].
groups: Sequence[str] | None.
If provided, keep only samples where adata.obs[groupby] is in groups.
Also defines the preferred ordering of categories (if present).
Gene selection from the DE table.#
top_n: int (default 50).
Number of genes to display. Interpretation depends on mode.
mode: “up” | “down” | “both” | “abs” (default “both”).
How to choose genes using the sign/magnitude of log2FC:
“up” : top top_n genes with log2FC > 0
“down” : top top_n genes with log2FC < 0
“abs” : top top_n genes by abs(log2FC)
“both” : split into up/down: top_n//2 up + remaining down.
sort_by: “qval” | “pval” | “log2FC” | “t” (default “qval”). Primary sorting used before filtering by mode:
“qval” / “pval”: ascending (most significant first)
“log2FC” / “t”: descending (largest first).
Note: gene selection uses the DE table; heatmap values come from layer.
Scaling / visualization transform#
z_score: “row” | “none” (default “row”).
If “row”, z-scores per gene across plotted samples/groups (i.e., per heatmap row).
If “none”, uses raw expression values from layer.
clip_z: float | None (default 3.0).
If z-scoring, optionally clip z-scores to [-clip_z, +clip_z].
Plot styling#
cmap: str (default “vlag”).
Colormap for heatmap.
center: float (default 0.0).
Center value passed to seaborn; typically meaningful for z-scored data.
col_colors: str | Sequence[str] | None.
One or more adata.obs keys to annotate columns (samples) with color bars.
Values are mapped per key using a categorical palette (tab20).
dendrogram_rows: bool (default True).
Cluster genes.
dendrogram_cols: bool (default True).
Cluster samples.
show_sample_labels: bool (default False).
Show/hide sample names on x-axis (often too dense for many samples).
figsize: (w, h) | None.
Auto-sized if None:
w = max(6.0, 0.15 * n_samples + 3.0)
h = max(4.8, 0.18 * n_genes + 2.2)
cbar_label : str (default “z-scored expression”) Colorbar label.
Output#
save: str | Path | None. Save figure using _savefig(cg.fig, save).
show: bool (default True). Calls plt.show().
What it does#
Loads DE results from adata.uns[de_key][contrast][results_key].
Sorts the DE table by sort_by (with fallback if missing).
Selects genes according to mode and top_n.
Filters to genes present in adata.var_names.
Extracts expression from layer for the selected genes.
Optionally subsets and orders samples by groupby/groups.
Builds a genes × samples matrix.
Optionally z-scores per gene and clips.
Draws sns.clustermap with optional col_colors annotations.
Sets a title like: “{contrast} — top {top_n} ({mode})”.
Returns#
cg: seaborn.matrix.ClusterGrid.
The clustermap object (access figure via cg.fig, axes via cg.ax_heatmap, etc.).
Raises#
ImportError if seaborn is not installed.
KeyError if: – the DE results path is missing – groupby / col_colors keys are not in adata.obs
ValueError if: – DE results lack required columns (gene, log2FC) – no selected genes exist in adata.var_names – (edge cases) empty data after filtering
Notes / tips#
For interpretability across genes, keep z_score=”row” (recommended).
If you want absolute expression levels, use z_score=”none” and consider setting center=None (this function passes center only when z-scoring).
If you pass groups=[…], it both filters and orders samples by that list (when possible).
col_colors is great for showing batch/subtype alongside the heatmap.
Examples#
Basic: top up+down genes for a contrast
cg = bk.pl.heatmap_de(adata, contrast="Subtype:Basal_vs_Luminal")
Only upregulated genes, sorted by log2FC
cg = bk.pl.heatmap_de(
    adata,
    contrast="Subtype:Basal_vs_Luminal",
    mode="up",
    sort_by="log2FC",
    top_n=40,
)
Group means heatmap-like behavior via sample ordering + annotations
cg = bk.pl.heatmap_de(
    adata,
    contrast="Treatment:Drug_vs_Control",
    groupby="Subtype",
    groups=["Basal", "Luminal", "Normal"],
    col_colors=["Subtype", "Batch"],
    top_n=60,
    mode="abs",
    z_score="row",
    show_sample_labels=False,
)
Save figure
bk.pl.heatmap_de(
    adata,
    contrast="Subtype:Basal_vs_Luminal",
    save="de_heatmap.png",
    show=False,
)