oncoprint#
- bullkpy.pl.oncoprint(adata, *, mut_cols, expr_genes=None, layer='log1p_cpm', sort_genes=True, sort_samples='mut_first', drop_all_wt=True, max_samples=None, groupby=None, group_order=None, group_blocks=True, within_group_sort='mut_first', show_sample_labels=False, mut_color='#222222', wt_color='#FFFFFF', grid_color='0.85', expr_cmap='viridis', expr_vmin=None, expr_vmax=None, expr_zscore=False, cell_size=None, row_height=0.35, expr_row_height=0.25, top_annotation_height=0.35, title=None, figsize=None, fontsize=10.0, save_dpi=None, max_pixels=60000, save=None, show=True)[source]#
Binary oncoprint (mut vs wt) from adata.obs 0/1 columns. Implements mutation-first sample ordering and optional group blocks.
Binary oncoprint (mutation vs wild-type) built from 0/1 indicator columns in adata.obs, with Scanpy-like conveniences:
Mutation matrix:
samples × genesfrommut_cols(obs columns).Sample ordering: mutation-first or mutation burden.
Optional group blocks: keep groups contiguous (e.g., subtype blocks) and optionally sort within each group.
Optional expression tracks: add a heatmap of expression for selected
expr_genesbeneath the mutation grid.Safe saving: automatically reduces DPI if the resulting pixel dimensions would be enormous.
Returns a Matplotlib (fig, ax); ax is the main mutation panel.
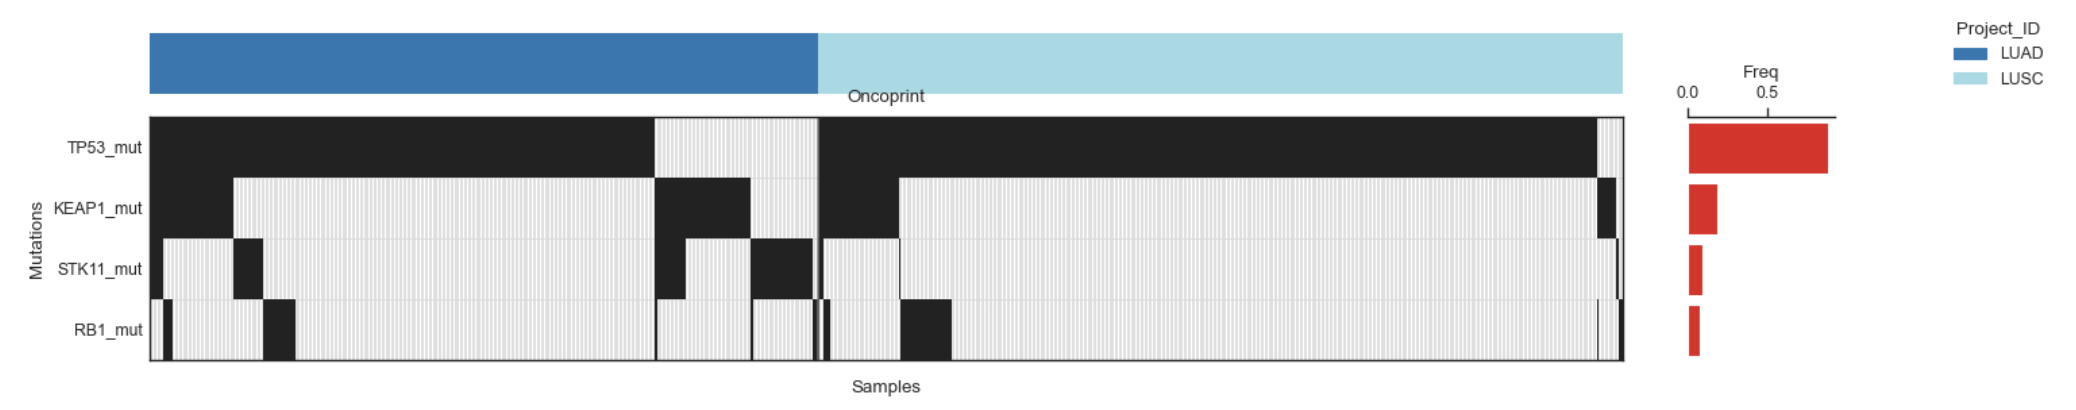
Example Oncoprint for mutations in the selected genes
What it does#
Mutation panel (main oncoprint)
Reads a binary mutation matrix from adata.obs[mut_cols].
Each column in mut_cols should encode mutation status for a gene/feature across samples (0/1).
Plots a grid:Rows = genes/features (from mut_cols)
Columns = samples
Black (by default) = mutated (1)
White (by default) = wild-type (0).
Adds a frequency bar at the right: per-gene mutation frequency across displayed samples.
Group strip (optional).
If groupby is provided and group_blocks=True, a colored strip is drawn on top:
Groups are kept contiguous.
Vertical separators are drawn at group boundaries.
A legend is added for the groups.
Expression tracks (optional).
If expr_genes is provided:
Extracts expression for those genes (from layer if present, else adata.X).
Adds an expression heatmap below the mutation panel.
If expr_zscore=True, expression is z-scored per gene across samples before plotting.
Output safety (saving).
When save is set, the function estimates the output image size in pixels and reduces DPI if necessary so dimensions stay under max_pixels in either direction (prevents Matplotlib “too large image” errors).
Parameters#
Core inputs.#
adata: AnnData.
Data container. Mutation status is read from adata.obs. Expression tracks use layer/adata.X.
mut_cols: Sequence[str].
Names of adata.obs columns encoding mutation status (expected 0/1 or boolean-like).
expr_genes: Sequence[str] | None.
Optional genes to show as an expression heatmap track under the mutation panel.
layer: str | None.
Expression layer used for expr_genes (default “log1p_cpm”). If missing, falls back to adata.X.
Ordering and filtering.#
drop_all_wt: bool. If True, removes samples with no mutations in any of mut_cols. Raises if none remain.
sort_genes: bool.
If True, sorts genes by mutation frequency (most frequent first).
sort_samples: {“mut_first”, “burden”, “none”}.
How to order samples when not using group blocks:
“mut_first”: lexicographic “mutation-first” ordering across genes (Scanpy/oncoprint-style)
“burden”: sort by total mutation count per sample (descending)
“none”: keep current order.
max_samples: int | None.
If set and too many samples remain, truncates to the first max_samples after filtering.
####Group blocks.
groupby: str | None. Categorical obs key used to define sample blocks (e.g. subtype).
group_order: Sequence[str] | None.
If provided, orders group blocks in this exact order.
group_blocks: bool. If True (and groupby provided), keeps groups contiguous and sorts within each group using within_group_sort.
within_group_sort: {“mut_first”, “burden”, “none”}. Ordering applied within each group block.
####Styling and sizing.
show_sample_labels: bool. If True, show sample names along the x-axis (can get crowded).
mut_color / wt_color: str. Colors for mutated / wild-type cells.
grid_color: str. Minor gridline color.
expr_cmap: str. Colormap for expression track.
expr_vmin / expr_vmax: float | None. Manual bounds for expression color scaling.
expr_zscore: bool. If True, z-score each expression gene across samples before plotting.
cell_size: float | None.
Inches per sample (column). If None, chosen automatically to keep width manageable.
row_height: float.
Inches per mutation row (gene) in the mutation panel.
expr_row_height: float.
Inches per expression-row (gene) in the expression track.
top_annotation_height: float.
Height (in inches) of the group strip when groupby is used.
title: str | None.
Plot title (default: “Oncoprint”).
##Output
save: str | Path | None.
If provided, saves the figure to this path (creates parent directories).
save_dpi: int | None.
Override DPI used for saving. If too large, may be reduced to satisfy max_pixels.
max_pixels: int.
Maximum allowed pixel dimension (width or height) when saving.
show: bool.
If True, calls plt.show().
Returns#
fig: matplotlib.figure.Figure
ax: matplotlib.axes.Axes. The main mutation-panel axis.
Raises#
KeyError if groupby is set but not present in adata.obs.
ValueError if drop_all_wt=True and no samples have any mutations in mut_cols.
(Other helper functions may raise if mutation columns are not interpretable as binary.).
##Expected input format for mut_cols
Each mut_cols entry should be an obs column representing mutation status per sample, e.g.:
integers: 0/1
booleans: False/True
string-ish encodings are not recommended unless _binary_from_obs supports them.
Examples#
Basic oncoprint from obs mutation calls
bk.pl.oncoprint(
    adata,
    mut_cols=["TP53_mut", "KRAS_mut", "EGFR_mut"],
)
Mutation-first ordering + subtype blocks
bk.pl.oncoprint(
    adata,
    mut_cols=["TP53_mut", "RB1_mut", "PIK3CA_mut"],
    groupby="Subtype",
    group_blocks=True,
    within_group_sort="mut_first",
)
Add expression tracks for marker genes
bk.pl.oncoprint(
    adata,
    mut_cols=["TP53_mut", "RB1_mut", "KRAS_mut"],
    expr_genes=["MKI67", "EPCAM", "VIM"],
    layer="log1p_cpm",
    expr_zscore=True,
)

Oncoprint plus expression of selected genes.
Cap samples for very large cohorts and save safely
bk.pl.oncoprint(
    adata,
    mut_cols=mut_cols,
    max_samples=300,
    save="oncoprint.png",
    save_dpi=200,
    show=False,
)