Leading edge Jaccard heatmap#
- bullkpy.pl.leading_edge_jaccard_heatmap(pre_res, *, term_idx=None, terms=None, min_shared_genes=0, row_cluster=True, col_cluster=True, cmap='viridis', vmin=0.0, vmax=1.0, figsize=None, show_labels=True, label_fontsize=9.0, dendrogram_ratio=(0.06, 0.12), title=None, show_title=True, save=None, show=True)[source]#
Compute and visualize Jaccard similarity between leading-edge gene sets for selected GSEA pathways/terms. This helps you detect clusters of pathways driven by overlapping leading-edge genes.
Jaccard(A, B) = |A ∩ B| / |A ∪ B|
Rows/Cols = pathways (terms)
Cell value = similarity in
[0, 1]Plotted with seaborn
clustermap(optional hierarchical clustering on rows/cols).
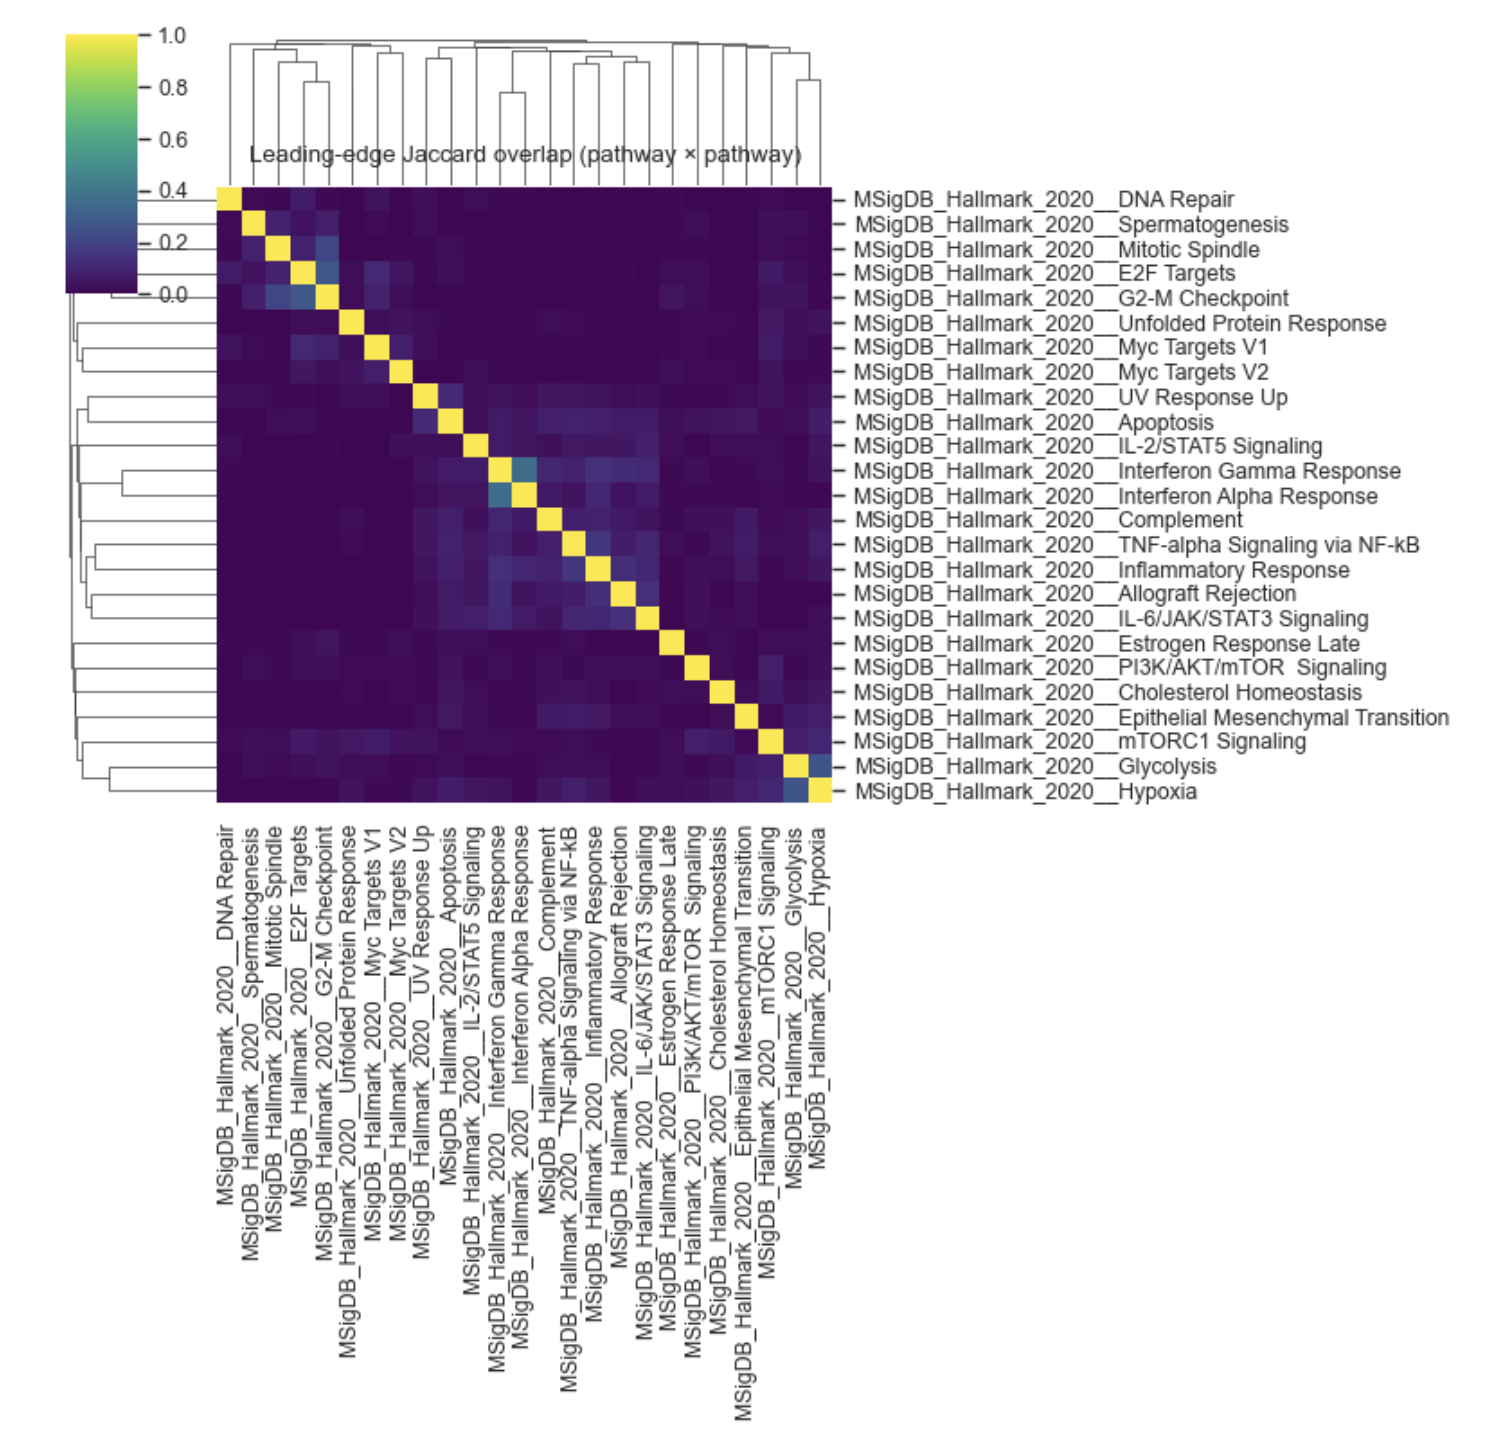
Example Leading edge Jaccard heatmap
Parameters#
Required#
pre_res
A GSEApy prerank result object (the pre_res returned by gseapy.prerank(…)).
This function expects that pre_res contains enough information to recover each term’s leading-edge genes, via the internal helper _leading_edge_sets(pre_res, …).
Term selection#
term_idx: None or index-like
Optional selection mechanism understood by _leading_edge_sets. Use this when you want to select terms by index/rank rather than by name.
terms: Sequence[str] | None
Explicit list of term names to include (subset of available terms in pre_res).
If neither is provided, the helper typically returns leading-edge sets for all available terms.
Similarity “denoising”#
min_shared_genes: int (default 0)
If > 0, similarities for pairs with intersection size < min_shared_genes are set to 0 (except diagonal).
This is purely for visualization—useful to remove weak overlaps in dense plots.
Clustering / heatmap controls#
row_cluster: bool (default True). Cluster pathways on rows.
col_cluster: bool (default True). Cluster pathways on columns (often keep True for symmetry).
cmap: str (default “viridis”). Colormap for similarity.
vmin, vmax: float (defaults 0.0, 1.0). Color scale limits (Jaccard naturally lies in [0,1]).
figsize: (w, h) | None. If None, uses an auto square size: max(6, 0.35*n + 3) where n is number of terms.
show_labels: bool (default True) Whether to show pathway labels on axes.
label_fontsize: float (default 9.0). Font size for axis labels when shown.
Output#
save: str | Path | None. If provided, saves the figure using _savefig.
show: bool (default True). Calls plt.show().
What it does#
Validates dependencies.
Requires seaborn (uses sns.clustermap).Extracts leading-edge gene sets. Calls:
term_names, le_sets = _leading_edge_sets(pre_res, term_idx=term_idx, terms=terms)
le_sets is expected to be: term -> set(genes).
Computes pairwise Jaccard.
Builds an n × n matrix J for all term pairs:
inter = len(A ∩ B)
union = len(A ∪ B)
J = inter/union (or 0.0 if union == 0).
Optional denoising. If min_shared_genes > 0, sets J[i, j] = 0 when |A ∩ B| is too small (excluding diagonal).
Plots clustermap.
Uses seaborn clustermap with provided clustering and color scaling.
Rotates x tick labels 90° if show_labels=True.
Returns#
dfJ: pd.DataFrame. Square similarity matrix (index/columns = term names).
g: seaborn ClusterGrid. The sns.clustermap output, useful for customizing the figure further.
Raises#
ImportError if seaborn is not installed.
Any error thrown by _leading_edge_sets if terms cannot be resolved or leading-edge data is missing.
Notes / tips#
For many terms, the plot can be crowded: – pass a subset via terms=[…] – set show_labels=False – increase figsize
min_shared_genes is handy when you have many weak overlaps that obscure stronger structure.
Because the matrix is symmetric, it’s common to keep both row_cluster=True and col_cluster=True.
Examples#
Default (cluster pathways by leading-edge similarity)
dfJ, g = bk.pl.leading_edge_jaccard_heatmap(pre_res)
Focus on a curated subset + denoise weak overlaps
terms = [
    "HALLMARK_E2F_TARGETS",
    "HALLMARK_G2M_CHECKPOINT",
    "HALLMARK_MTORC1_SIGNALING",
    "HALLMARK_INTERFERON_GAMMA_RESPONSE",
]
dfJ, g = bk.pl.leading_edge_jaccard_heatmap(
    pre_res,
    terms=terms,
    min_shared_genes=5,
    cmap="viridis",
    figsize=(8, 8),
)
Large term set: hide labels
dfJ, g = bk.pl.leading_edge_jaccard_heatmap(
    pre_res,
    term_idx=range(50),   # if your helper supports indexing
    show_labels=False,
)